Integrate Zeek Network Telemetry with Wazuh (Part 11)
How to install Zeek on selected hosts, collect JSON logs with the Wazuh agent, and promote them into custom network-security rules.
Published · Republished on Medium

Host logs are not enough.
ClamAV tells you a file matched a signature. YARA tells you a file matched a custom pattern. auditd tells you which commands ran on a host.
But none of those tell you:
- what a host connected to
- what DNS names it resolved
- what HTTP requests it sent
- what TLS endpoints returned suspicious certificates
- when network behavior crosses into obvious notice-level activity such as scanning or password guessing
That is where Zeek fits in this repo.
For this repo, the useful network-monitoring baseline is:
- outbound connection visibility
- DNS failures and suspicious lookup patterns
- HTTP request paths
- TLS certificate and protocol hygiene
- SSH authentication behavior and password guessing
- file transfer visibility
- Zeek notice-level escalations
Files in This Post
bash
playbooks/
├── zeek.yml
├── wazuh-custom-rules.yml
└── wazuh-agent-config.yml

roles/
├── zeek/
├── wazuh_agent_config/
└── wazuh_custom_rules/

inventories/lab/files/zeek/
├── default/
├── keycloak/
└── clamav-db/

inventories/lab/files/wazuh-agents/
├── default/ossec.conf
├── keycloak/ossec.conf
└── clamav-db/ossec.conf

inventories/lab/files/wazuh/config/
├── decoders/local_decoder.xml
└── rules/wazuh_custom_rules.xml
Depends on:
The Deployment Model
Zeek is deployed with one playbook:
yaml
# playbooks/zeek.yml
- name: Install and configure Zeek
  hosts: keycloak:clamav_database
  become: true
  roles:
    - role: zeek
And the Wazuh agent file inputs are deployed separately:
yaml
# playbooks/wazuh-agent-config.yml
- name: Update Wazuh agent ossec.conf from inventory
  hosts: keycloak:clamav_database
  become: true
  gather_facts: true
  roles:
    - role: wazuh_agent_config
That split is deliberate.
The zeek role installs Zeek itself. It does not modify the Wazuh agent configuration. The Wazuh-side file collection remains the responsibility of wazuh_agent_config.
The manager-side decoder and rule deployment is also separate:
yaml
# playbooks/wazuh-custom-rules.yml
- name: Deploy Wazuh custom local rules
  hosts: wazuh_manager:aio
  become: true
  gather_facts: false
  roles:
    - role: wazuh_custom_rules
That separation matters because the complete Zeek-to-Wazuh path spans three independent Ansible concerns:
zeek.ymlinstalls and configures Zeek on sensor hostswazuh-agent-config.ymltells the agent which Zeek logs to shipwazuh-custom-rules.ymlinstalls the decoder and rule logic on the manager
What the Zeek Role Does
The role is small and explicit:
- install prerequisite packages
- add the Zeek repository for Ubuntu 24.04
- install the pinned and tested
zeek-8.0package version - deploy
node.cfg,local.zeek, andzeek.service - enable and start the service
- validate runtime status and log directory creation
Current install path:
yaml
- name: Install Zeek package
  ansible.builtin.apt:
    name: zeek-8.0
    state: present  # Pin the exact package version in the real inventory/lock data.
And runtime validation:
bash
- name: Check Zeek runtime status
  command: /opt/zeek/bin/zeekctl status

- name: Validate active log directory exists
  stat:
    path: /opt/zeek/logs/current
If /opt/zeek/logs/current does not exist, the role fails immediately.
That is the correct behavior. Silent NSM failure is worse than no NSM at all.
Static Files, Host Overrides
The role resolves config with first_found using:
ec2_nameinventory_hostnamedefault
That applies to:
node.cfglocal.zeekzeek.service
Current tree:
text
inventories/lab/files/zeek/
├── default/
│   ├── local.zeek
│   ├── node.cfg
│   └── zeek.service
├── keycloak/
│   ├── local.zeek
│   ├── node.cfg
│   └── zeek.service
└── clamav-db/
    ├── local.zeek
    ├── node.cfg
    └── zeek.service
So Zeek follows the same repo pattern as the rest of the lab: static files in inventory, host-specific override only when needed.
Why JSON Logs Matter
Zeek is configured here as a JSON log producer, because that makes Wazuh integration straightforward.
The Wazuh agent already knows how to tail JSON log files. So instead of introducing a separate transport, the repo just points the agent at Zeek’s log directory.
Examples from the agent config:
xml
<localfile>
  <log_format>json</log_format>
  <location>/opt/zeek/logs/current/conn.log</location>
</localfile>

<localfile>
  <log_format>json</log_format>
  <location>/opt/zeek/logs/current/dns.log</location>
</localfile>

<localfile>
  <log_format>json</log_format>
  <location>/opt/zeek/logs/current/http.log</location>
</localfile>

<localfile>
  <log_format>json</log_format>
  <location>/opt/zeek/logs/current/ssl.log</location>
</localfile>

<localfile>
  <log_format>json</log_format>
  <location>/opt/zeek/logs/current/ssh.log</location>
</localfile>

<localfile>
  <log_format>json</log_format>
  <location>/opt/zeek/logs/current/files.log</location>
</localfile>

<localfile>
  <log_format>json</log_format>
  <location>/opt/zeek/logs/current/weird.log</location>
</localfile>

<localfile>
  <log_format>json</log_format>
  <location>/opt/zeek/logs/current/reporter.log</location>
</localfile>

<localfile>
  <log_format>json</log_format>
  <location>/opt/zeek/logs/current/notice.log</location>
</localfile>
That pattern is present in:
inventories/lab/files/wazuh-agents/default/ossec.confinventories/lab/files/wazuh-agents/keycloak/ossec.confinventories/lab/files/wazuh-agents/clamav-db/ossec.conf
So the telemetry path is:
text
Zeek -> /opt/zeek/logs/current/*.log -> Wazuh agent localfile -> decoder -> custom ruleImportant detail: the repo now promotes these Zeek logs into custom Wazuh detections:
conn.logdns.loghttp.logssl.logssh.logfiles.logweird.logreporter.lognotice.log
stderr.log is still shipped for troubleshooting, but it is not part of the custom decoder/rule set in this chapter because it is operational process output rather than structured network telemetry.
Decoders: Only the Useful Fields
The custom decoders live in local_decoder.xml.
There are now nine Zeek decoders:
zeek-connzeek-dnszeek-httpzeek-sslzeek-sshzeek-fileszeek-weirdzeek-reporterzeek-notice
The original implementation used an order-dependent regular expression such as the example below:
xml
<decoder name="zeek-http">
  <parent>json</parent>
  <prematch>"method":</prematch>
  <regex type="pcre2">"id.orig_h":"(\d+\.\d+\.\d+\.\d+)".+"id.orig_p":(\d+).+"id.resp_h":"(\d+\.\d+\.\d+\.\d+)".+"id.resp_p":(\d+).+"method":"([^"]+)".+"host":"([^"]+)".+"uri":"([^"]+)".+"status_code":(\d+)</regex>
  <order>srcip,srcport,dstip,dstport,http_method,http_host,http_uri,http_status_code</order>
</decoder>
JSON object key order is not a stable contract, and the IPv4-only expression also misses IPv6. Wazuh already includes a JSON decoder that extracts structured values into dynamic fields. Prefer rules over those decoded fields, or use a tested normalization step, rather than parsing serialized JSON order with one wide regex. Keep fixtures for missing optional keys, reordered keys, IPv4, IPv6, escaped values, and schema changes.
The repo does not try to decode every Zeek field. It only extracts the ones that are useful for alerting and pivots:
- source and destination IP
- source and destination port
- DNS query and answers
- HTTP method, host, URI, and status
- TLS version, cipher, server name, and validation status
- SSH version, auth success, and auth attempts
- file source, MIME type, and observed bytes
- weird event name / notice state
- reporter level and message
- notice type, message, and related peer context
That keeps the rules readable.
It also keeps the regex cost bounded on the Wazuh manager. Zeek JSON can be quite wide, so only the fields used by alert descriptions and pivots are extracted into named decoder fields.
Rules: 105000–105999
The Zeek rule block lives in wazuh_custom_rules.xml.
The current ranges are:
text
105000-105009  conn.log
105010-105019  dns.log
105020-105029  http.log
105030-105039  ssl.log
105040-105049  ssh.log
105050-105059  files.log
105060-105069  weird.log
105070-105079  reporter.log
105080-105089  notice.log
Examples:
Connection event:
xml
<rule id="105000" level="3">
  <decoded_as>zeek-conn</decoded_as>
  <description>Zeek connection event from $(srcip):$(srcport) to $(dstip):$(dstport) state $(connection_state).</description>
  <group>zeek,conn,nsm,</group>
</rule>
Rejected connection escalation:
xml
<rule id="105001" level="7">
  <if_sid>105000</if_sid>
  <field name="connection_state">REJ</field>
  <description>Zeek rejected connection from $(srcip):$(srcport) to $(dstip):$(dstport).</description>
  <group>zeek,conn,rejected,</group>
</rule>
TLS self-signed certificate:
xml
<rule id="105031" level="8">
  <if_sid>105030</if_sid>
  <field name="ssl_validation_status">self signed certificate</field>
  <description>Zeek SSL/TLS self-signed certificate detected for $(ssl_server_name).</description>
  <group>zeek,ssl,</group>
</rule>
There are also suppression rules for expected noise such as:
- mDNS on source port
5353 cti.wazuh.comDNS lookups
That keeps the signal cleaner in the dashboard.
Additional examples now covered by this rule block:
105014: DNS NXDOMAIN result105015: long or heavily segmented DNS query that can indicate suspicious lookup patterns105022: HTTP request to suspicious path such as/wp-login.php,/admin,/.env, or/.git105033: TLS connection using a legacy protocol such asTLSv10orTLSv11105041: SSH authentication failure105042: SSH session with multiple authentication attempts105051: executable-like file transfer detected infiles.log105061:weird.logevent escalated when Zeek marks it as a notice105071:reporter.logerror event105080: Zeek notice event promoted into Wazuh105081: high-value Zeek notice such as password guessing or scan activity
In practice, that means the repo is now monitoring these network-level categories:
- connection outcomes
- suspicious DNS behavior
- suspicious HTTP behavior
- TLS hygiene
- SSH authentication anomalies
- executable-like file transfer
- protocol weirdness and Zeek runtime issues
- notice-level security events
End-to-End Flow
To make Zeek visible in Wazuh, you need all of these pieces:
- deploy Zeek
- deploy Wazuh agent
ossec.conf - deploy custom decoders and rules to the manager
- restart the relevant services
That means this chapter is not just “install Zeek package”.
It is a multi-part integration:
text
Zeek host files
  -> zeek role
  -> agent localfile entries
  -> Wazuh decoder
  -> Wazuh custom rules
  -> dashboard alerts/search
Testing Strategy
There are two practical ways to test this integration.
- generate real traffic so Zeek writes the logs naturally
- append synthetic JSON lines so Wazuh receives deterministic test events for rule validation
Use both.
Real traffic proves the sensor sees packets on the configured capture interface. Deterministic fixtures passed through wazuh-logtest prove each decoder and rule still matches even when the live network is quiet.
One detail matters here: eth0 is not portable. Cloud images may use names such as ens4, ens5, or enp1s0, and the default-route interface may not carry mirrored traffic. Discover candidates from system facts and routes, require an explicitly approved capture interface, and fail deployment when it does not exist. Tests must cross that interface; localhost traffic will not validate it.
Verification
Deploy Zeek:
bash
ansible-playbook -i inventories/lab/hosts.ini playbooks/zeek.yml
ansible-playbook -i inventories/lab/hosts.ini playbooks/wazuh-custom-rules.yml --limit aio
ansible-playbook -i inventories/lab/hosts.ini playbooks/wazuh-agent-config.yml
If you skip the manager playbook, the agent will still ship the JSON logs, but you will only get generic JSON events instead of the 105xxx Zeek detections described in this post.
Useful host checks:
bash
/opt/zeek/bin/zeekctl status
ls -la /opt/zeek/logs/current
head -n 3 /opt/zeek/logs/current/dns.log
head -n 3 /opt/zeek/logs/current/http.log
head -n 3 /opt/zeek/logs/current/ssh.log
If ssh.log does not exist yet, that usually means the host has not seen SSH traffic on eth0 yet.
Generate Real Zeek Traffic
The fastest live checks are:
bash
# DNS
dig example.org

# Plain HTTP
curl -A zeek-test http://neverssl.com/ >/dev/null

# TLS with certificate findings
curl -skI https://self-signed.badssl.com/ >/dev/null
curl -skI https://expired.badssl.com/ >/dev/null

# SSH to another lab host on the same network segment
ssh -o StrictHostKeyChecking=no \
    -o PreferredAuthentications=password \
    -o PubkeyAuthentication=no \
    ubuntu@<other-lab-host-ip> exit || true
That traffic usually gives you:
conn.logfrom all of the abovedns.logfromdighttp.logfrom the plain HTTP requestssl.logfrom the HTTPS requestsssh.logfrom the SSH connection attempt
files.log, weird.log, reporter.log, and notice.log are less deterministic from casual traffic. For those, use sanitized JSON fixtures with wazuh-logtest or an isolated test input. Do not append synthetic lines to production Zeek logs, because that mixes tests with evidence and can trigger real response automation.
Wazuh Queries For Evidence
Use these searches in Wazuh Dashboard -> Security Events:
text
rule.id:105000
rule.id:105010
rule.id:105020
rule.id:105030
rule.id:105040
rule.id:105050
rule.id:105060
rule.id:105070
rule.id:105080
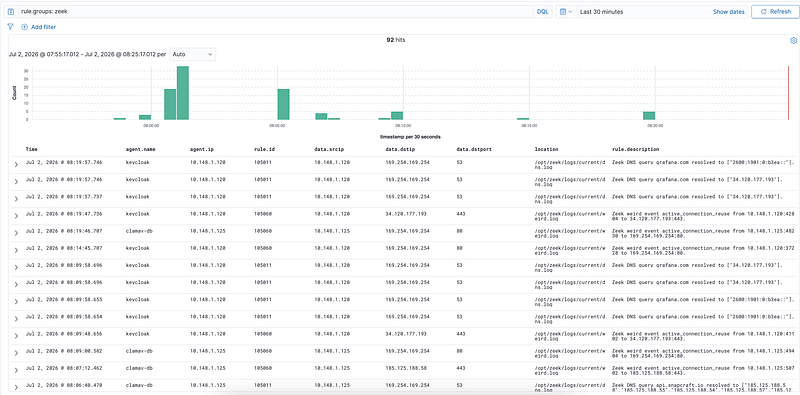
rule.groups: zeek
More useful grouped searches:
text
agent.name: keycloak AND rule.groups: zeek
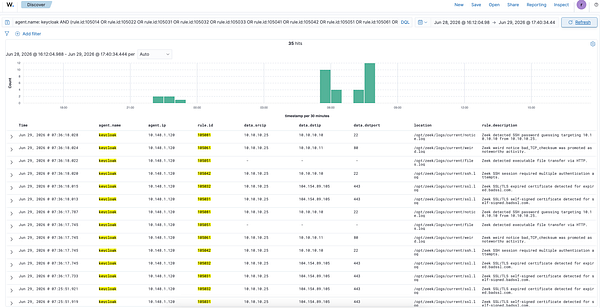
agent.name: keycloak AND (rule.id:105014 OR rule.id:105015 OR rule.id:105022 OR rule.id:105031 OR rule.id:105032 OR rule.id:105033 OR rule.id:105041 OR rule.id:105042 OR rule.id:105051 OR rule.id:105061 OR rule.id:105071 OR rule.id:105081)
agent.name: keycloak AND rule.id:[105000 TO 105089]
The second query is usually the most useful during validation because it isolates the escalated findings instead of the base telemetry.
The value here is not deep packet capture forensics.
It is practical network telemetry inside the same Wazuh workflow I already use for:
- file detections
- audit detections
- service logs
- host integrity events
Volume, Rotation, and Backpressure
Connection telemetry can be much higher-volume than host alerts. Establish a baseline by stream and sensor: events per second, bytes per day, unique-field cardinality, Wazuh agent queue utilization, manager decoding rate, index growth, dropped packets, Zeek capture loss, and delayed ingestion. A base rule for every connection can be expensive; retain or sample it according to the hunting requirement and reserve alerts for actionable conditions.
Zeek's logging framework supports global or per-filter rotation. ZeekControl configures rotation automatically, but verify it in the deployed mode and set retention and compression explicitly. Monitor writer failures, disk usage, stale current symlinks, Wazuh logcollector lag, dropped agent events, and packet loss. A running process with no fresh logs is not a healthy sensor.
Test rotation and Wazuh tailing together so events are neither duplicated nor missed across rename and reopen. If forwarding cannot keep up, reduce unnecessary streams or fields and increase capacity from measurements; do not silently discard telemetry.
Privacy and Retention
DNS names, HTTP host and path data, certificates, internal addresses, usernames, and file-transfer metadata can identify people and expose sensitive application details. Define collection purpose, network scope, access control, masking needs, retention, legal basis, and deletion behavior before enabling broad capture. Zeek metadata is not full packet capture, but it remains sensitive monitoring data.
Keep only fields required for detections and investigations. Avoid credentials, request bodies, and unnecessary URI query values. Align local Zeek rotation, Wazuh archives, index retention, and backups so data is not retained indefinitely in one layer after deletion from another.
Rollout and Rule Regression
Deploy one sensor first and record the exact Zeek, Wazuh, package, kernel, capture-interface, and policy versions. Test JSON fixtures for each stream with the expected rule ID, level, and decoded fields; include reordered and missing fields plus benign near-misses. Then generate authorized traffic over the actual interface and compare packet counters, Zeek logs, Wazuh receipt, rule matches, and indexed documents.
Rollback restores the previous Zeek configuration, Wazuh agent inputs, decoders, and rules independently. Stop capture if it threatens host stability or privacy boundaries, but retain enough operational logging to diagnose the failure.